 Euro printed a higher relative volume hammer-like candle. This suggests that the last 2 days were a retracement and it is ready to move higher. If it breaks out of the triangle consolidation and closes above the recent resistance levels of 1.4500, then the likely upside target, using the triangle consolidation's range on the wide opening, is around 1.5430, which is around 1050 ticks from today's close.
Saturday, July 30, 2011
Euro update July 29, 2011
Euro printed a higher relative volume hammer-like candle. This suggests that the last 2 days were a retracement and it is ready to move higher. If it breaks out of the triangle consolidation and closes above the recent resistance levels of 1.4500, then the likely upside target, using the triangle consolidation's range on the wide opening, is around 1.5430, which is around 1050 ticks from today's close.


Market update July 29, 2011

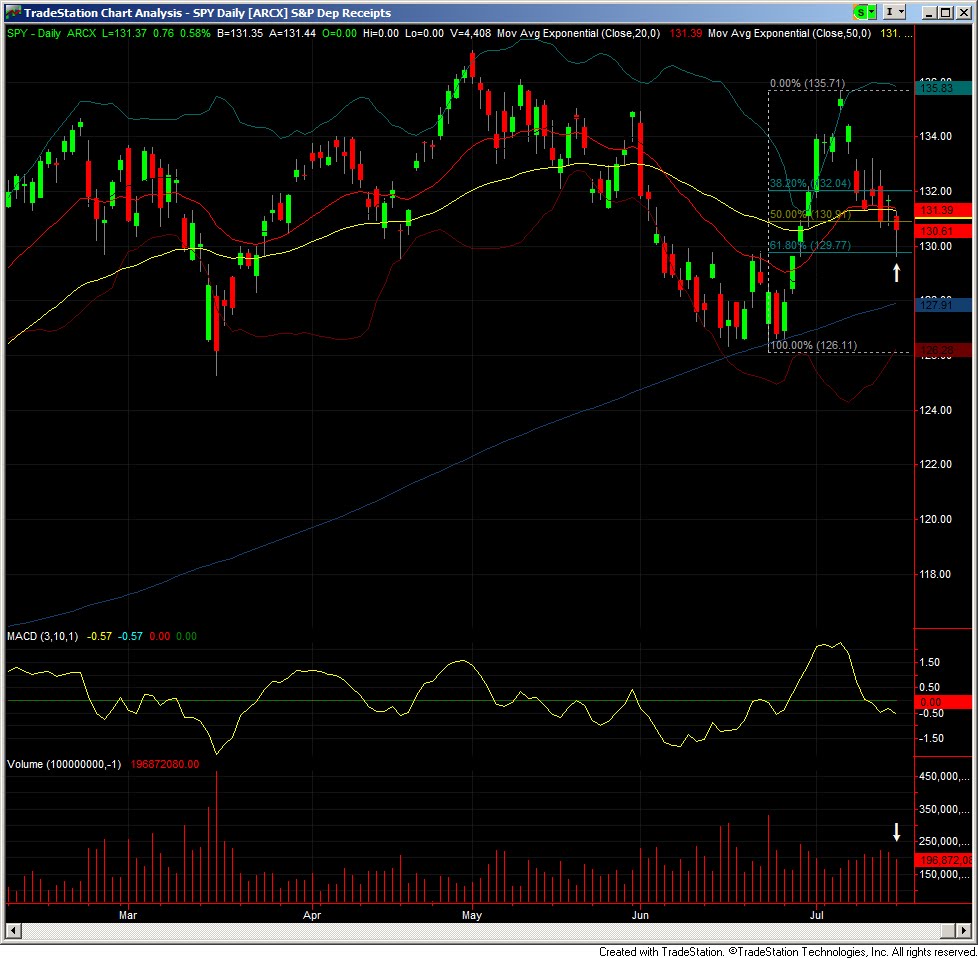
Market (SPY) printed a higher relative volume spinning top candle today. On Emini S&P (ES) futures chart, the candle looks hammer-like when you consider the overnight session which includes Asian and European trading. The Low of this hammer tested the drawn 127% fibonacci extension to the tick. Also the price bounced off the 200 day SMA (lower blue curve), and this price region was the support area during June.
My interpretation of this candle is that higher volume points to important support here. I expect the price to bounce from here. Now this bounce can be just a retracement and last a few days or it can be a reversal. Another possibility is that price hangs out here for a while before deciding which way to move next. And the third possibility is that price can just rip through this support completing the widely mentioned head and shoulders pattern and drop hard, though the likelihood of that happening is less than the two scenarios mentioned earlier, again that is pointed to be the volume and candle type. Also when everyone is talking about a head and shoulders pattern, its chances of materializing decrease.
Moreover, NASDAQ 100 (QQQ) printed a higher relative volume inverted hammer which again signals a bounce and it closed higher than 2 previous swing lows. As I mentioned in previous posts, this is most likely because 4 (AAPL, GOOG, MSFT, AMZN) of the 10 highest weightage stocks in the index are in strong uptrend.
Considering a broader perspective, the weekly candle hints at continuing down move, though it closed off the lows. Since, the month is also over, the monthly candle is a lower relative volume inverted hammer-like, which followed a higher volume hammer. This combination suggests higher chances of reversal than continuation to the down side.
Thursday, July 28, 2011
Market update July 28, 2011
 So, today market printed lower volume inverted hammer candle. Intraday, market direction was up until 12PM Eastern and then it spent the rest of the day giving it all back and then some more. Over all it was more of a day of rest after yesterday's high volume wide range decline day.
In my experience, an inverted hammer during a down swing can signal a reversal but for that to happen, the volume has to be higher than previous day. That is not the case here. But this doesn't mean that we cannot get a reversal as market is at the confluence of 61.8% fib retracement and lower Bollinger band while 200 day SMA is 1.5 points away. These are likely to provide some support.
Wednesday, July 27, 2011
Euro fakeout
 This is daily chart of Euro futures contract. I use futures chart instead of spot EUR/USD as it provides volume information which I use in my analysis. Euro had been consolidating in a symmetric triangle from start of May. On July 11, it broke below the lower trendline of the consolidation on higher volume. It appeared that finally there is a resolution from the consolidation. But Euro likes fooling traders a lot, and that happens on every timeframe. The next candle marked '1' on the chart was a higher volume hammer, with a tiny body a looooong lower wick. This was a clear hint that it is in no mood of going down for now. During next few sessions it crept back into the triangle, and then boom!, it ripped through it and now has broken out of the upper trendline. I am writing this post to commit a lesson to memory: don't overlook such clear hints or you'll pay the price (which I did).
Market update July 26, 2011
 Market continues to be in sideways consolidation. We had a low volume spinning top like day, as the wicks were too small. This type of candle doesn't really hint at anything. Intra-day, current support on SPY is at 133, which has been tested thrice during last 4 trading days. The likelihood of it holding is decreasing with every test. Next support levels seem to be around 131.50, 130 and then 126.50. On the other side, next resistance level is at 134.80.
QQQ reached new bull market highs a couple of days ago, probably because of the higher percentage weight of tech stocks like AAPL which is ripping higher post-earnings. QQQ's breakout was on anemic volume, so that really doesn't count.
Historically the longer market stays within the trading range, the bigger the move that follows. So, we need to be patient.
Friday, July 22, 2011
Market update July 21, 2011
 After 3 days of progressively lower volume rally market continued higher but this time on higher volume. Intra-day majority of volume was concentrated in the first half of the day and 134.75 was a significant level of resistance which market couldn't cross. Today's close is 2% from the current bull market high of 137.18.
How the price reacts around the previous swing high of 135.71 will determine the direction. From the current trend it appears that a breakout is imminent, but anything can happen.


Wednesday, July 20, 2011
Market update July 19, 2011
 As I mentioned yesterday, a lower volume hammer was not that strong a signal of start of a sustainable rally but today we got a gap up and the market closed near the highs of the day. Volume on SPY was a bit lower than yesterday, again not supportive of a rally but it was higher on QQQ. S&P futures including the overnight session also printed a bullish engulfing candle and that too on lower volume. So, there is a bit of divergence between the volumes of these 2 indices but one such day doesn't mean anything. Even if we see this situation on a number of days I don't know what to conclude from it. So, for now the path of least resistance is up until there is evidence otherwise.
Previously my opinion was that due to summer time, we might not see a breakout of the overall market from the current trading range before start of September. But considering that a number of leading stocks are forming bases and few have just broken out, it is quite possible that we see a breakout much sooner than start of September.
Disclaimer: No position in SPY, QQQ or ES.
Tuesday, July 19, 2011
Market update July 18, 2011
 After a long break, I am attempting to resume blogging about markets and trading with hopefully more insightful comments.
So, during my today's read of blogs a number of traders have pointed to the hammer candle in SPY, which has formed in one of the support zones. Although it is a positive sign, I do see one problem and that is lower volume. In my experience lower volume hammers rarely kick-off a rally. However, a bullish engulfing candle on higher volume tomorrow could confirm start of an up move. Or if price decides to stay in or close to this hammer's range could signal accumulation. Lets see what tomorrow brings.
Monday, April 12, 2010
60 Minute timeframe buy USD/JPY

This snapshot shows the basic setup that I try to take advantage of. Right now my trading is discretionary but I try to stay close to my trading rules, though more often than not I open position before the right time.
Here you can see 5 events that make it a good setup in my opinion:
1. Short lived bullish crossover of EMA20 over EMA50
2. Subsequent pullback forming higher low
3. Bullish MACD crossover
4. Net upward pressure forming right side of cup
5. Bar close above the downtrend line
A reasonable stop is 92.82 and target could be 94.80. Lets see how this trade turns out.
Disclosure: Long position in USD/JPY
Monday, March 29, 2010
QQQQ signals
 Today QQQQ is showing 3 signals of near term top:
- RSI curve trying to move below the overbought region
- A doji on the daily candlestick chart
- MACD crossing the signal line from above
Disclosure: No position in mentioned security.
Sunday, January 31, 2010

Thursday, November 26, 2009
Alarming news from Dubai
WSJ has a few stories regarding the crisis at Dubai World:
- Dubai World seeks debt standstill
- Dubai starts to untangle Dubai World fallout
- S&P puts four Dubai banks on credit watch
- Raining on Dubai's day at the beach
- European banks face potential Dubai World losses
- Dubai World standstill news hits regional confidence
- More bad news for Dubai investors
- Dubai World, a conglomerate spanning real estate and ports, announced a six-month standstill on the group's debt.
- Government-owned Dubai World appears in deep trouble as it struggles to deal with its debts and almost $60 billion of liabilities. Investors are concerned the company may default, sending the cost of insuring Dubai's sovereign debt skyrocketing.
- It now costs $570,000 to insure $10 million of Dubai sovereign debt against default for five-years, up from $440,000 at Wednesday's New York close.
- Moody's Investors Service and Standard & Poor's downgraded the debt of various Dubai government-related entities including DP World following the announcement of Dubai World's restructuring. Moody's downgraded the companies affected to junk.
- The Abu Dhabi-based Central Bank of the United Arab Emirates bought $10 billion of its emergency bonds in February. Majority Abu Dhabi-owned National Bank of Abu Dhabi and Al Hilal Bank bought another $5 bilion of Dubai's debt earlier Wednesday.
- Dubai World's biggest concerns are its troubled real-estate unit Nakheel and it's investment company Istithmar World. Nakheel, which borrowed heavily to build vast property projects including Palm shaped residential islands in the Persian Gulf, has suffered badly from a 50% fall in Dubai real-estate prices since last year.
- Istithmar said in September it had laid off staff and was in talks about restructuring its debt. It has halted investments this year after struggling to eke out a return on deals such as the $942 million purchase of U.S. department store Barneys.
- Dubai World almost $3 billion last year before the full extent of its financial problems emerged, according to its earnings statement for 2008. The document shows that Nakheel had approximately $2.5 billion identified as "loans to a related party" still outstanding at the end of the year.
- Dubai banks Emirates Bank International PJSC, National Bank of Dubai, Mashreqbank PSC and the Dubai Islamic Bank PJSC have all been put on credit watch by Standard & Poor's rating agency.
- The agency has placed its CreditWatch on the the 'A-' long-term rating for the four banks while affirming its 'A-2' short-term ratings on Emirates Bank International, National Bank of Dubai and Mashreqbank.
- In an October report, Standard & Poor's estimated Dubai World could be responsible for as much as 50% of Dubai's total government- and corporate-debt load of some $80 billion to $90 billion.
- In 2007, it joined up with in the $8.5 billion CityCenter project in Las Vegas. An MGM Mirage (MGM) spokesman said Wednesday that Dubai World had already fulfilled all of its commitments to funding the project, totaling some $4.65 billion.
- The same year, Dubai World's investment outfit Istithmar bought high-end retailer Barneys New York for just under $1 billion.
- Dubai World agreed to purchase half of MGM Mirage's CityCenter mixed-use casino project in August 2007 when the real estate market in Las Vegas had reached its peak. At that point CityCenter was only partially complete and the project's assets were valued at $5.4 billion. A little more than two years later, MGM Mirage said it was writing down around $2.34 billion in value for the project, which devalued Dubai World's stake in CityCenter by around $1.17 billion to $2.44 billion.
- Marios Maratheftis, Standard Chartered's Dubai-based regional head of research, is predicting 4% growth for Dubai in 2010, compared to a 1% contraction this year.
- Dubai is reliant on debt markets not only to pay for its ambitious infrastructure projects, but also to service previous borrowing that funded explosive growth in recent years. It and its corporate entities have nearly $50 billion in debt coming due over the next three years, according to Standard & Poor's.
- Developers, many of them state-owned, still owe whopping sums to international contractors. According to a London-based spokesman for the Association for Consultancy and Engineering, a trade group of British builders, Dubai entities owe as much as 200 million pounds to British contractors alone. Still, that's down from 400 million pounds earlier this year.
- Even after hundreds of projects were canceled or postponed this year, new construction is expected to double Dubai's supply of office space by 2011, according to property consultancy Colliers International. In a sample study, the consultancy found office-occupancy rates in recently finished buildings at just 41%. At the end of the third quarter, prices of office and residential space were down by 58% and 43%, respectively, from a year-ago, Colliers estimates.
- Earlier this month, Colliers reported the first pickup in residential property prices since the market started falling late last year. Residential prices-- measured at developments open to foreign purchasers--climbed by 7% in the third quarter. That's still down 47% year-on-year.
- European banks face potential losses on an estimated $40 billion in exposure to Dubai after the city state's largest corporate entity, Dubai World, asked creditors for a six month standstill on debt repayments.
- Bank analysts at NCB Stockbrokers said Standard Chartered PLC is the U.K. bank proportionately most exposed to the United Arab Emirates, with 7% of its loan book in the region. HSBC Holdings PLC has about 2% of its loan book in the region, while Barclays PLC, Royal Royal Bank of Scotland Group PLC and Lloyds Banking Group PLC have less than 1% of their loans in the UAE, according to NCB analysis.
- Credit Suisse analysts said European banks could face a 5% increase in their bad-loan provisions in 2010, or an aggregate hit of about €5 billion ($7.5 billion) after tax, if they lost 50% on their roughly $40 billion exposure to Dubai.
- A report by the Emirates Banks Association said the top eight foreign banks in the United Arab Emirates by lending volume -- HSBC, Standard Chartered, Barclays, Royal Bank of Scotland's ABN Amro, Citigroup Inc., BNP Paribas SA, Lloyds and Crédit Agricole SA's Calyon -- extended about $36 billion in loans last year throughout the federation.
- In the first half, Standard Chartered took $460 million in impairment charges against Middle East loans, 42% of its total group impairment, and up from $80 million in the first half of 2008, highlighting the rapid deterioration in the region's economy. HSBC's impairment charge in the Middle East in the first half was $391 million, up from $41 million in first-half 2008.
- Local and international banks are also licking their wounds from the debt troubles this year of two big family-run Saudi Arabian conglomerates, which owe more than 100 lenders a conservatively estimated $15 billion.
Thursday, October 8, 2009
Wednesday, September 23, 2009
3 Metrics to Consider Before Investing In a House
Mish mentioned the first 3 metrics to consider when investing in a house:
1) How much are home price out of whack with rental prices? (i.e. What does it cost to own vs. rent a similar house? Keep in mind maintenance, property taxes, etc.)
2) How much above the trendline growth in price appreciation are home prices selling? (Was there an unexpected or unwarranted acceleration in prices over a number of years?)
3) How much have home prices appreciated vs. wages
Saturday, September 19, 2009
Some Data Regarding Facebook
According to WSJ story, as of Sep 16:
- Total number of users: 300 million
- Number of users added during last 1.5 months: 50 million
- User location split US/International (%): 30/70
- First operating cash flow positive quarter: Q2 (Apr) 2009
- Expected 2009 revenue: $500 million (70% YoY growth)
Wednesday, September 2, 2009

USO Below Intermediate Term Trendline.

After repeated attempts to cross $39 mark, USO finally closed below the intermediate term trendline. MACD is also confirming waning momentum. Considering the weakness in the broader market and the strength in US dollar, its not surprising at all. Before opening a short position, it would be better to wait for a rally, which reverses at the trendline, confirming start of the down trend.
Full Disclosure: No position in USO.
Sunday, August 30, 2009
Divergence in Shanghai Composite.

Since Aug 19 low, Shanghai Composite has climbed a bit but this rise has not been confirmed by MACD resulting in a divergence. Hence, we need further evidence to be confident of a reversal in current (short term) down trend, or continuation of this trend to become intermediate or long term down trend.
Subscribe to:
Posts (Atom)