Showing posts with label SPY. Show all posts

Saturday, July 30, 2011

Market update July 29, 2011

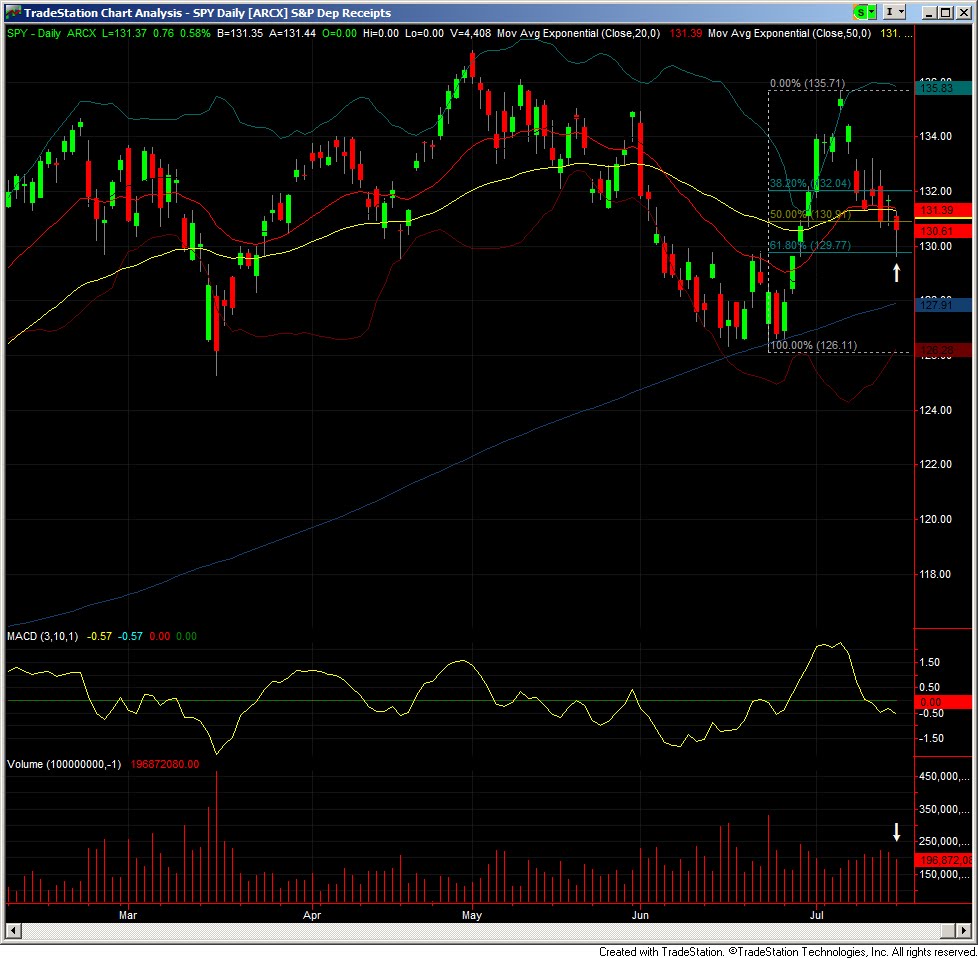
Market (SPY) printed a higher relative volume spinning top candle today. On Emini S&P (ES) futures chart, the candle looks hammer-like when you consider the overnight session which includes Asian and European trading. The Low of this hammer tested the drawn 127% fibonacci extension to the tick. Also the price bounced off the 200 day SMA (lower blue curve), and this price region was the support area during June.

My interpretation of this candle is that higher volume points to important support here. I expect the price to bounce from here. Now this bounce can be just a retracement and last a few days or it can be a reversal. Another possibility is that price hangs out here for a while before deciding which way to move next. And the third possibility is that price can just rip through this support completing the widely mentioned head and shoulders pattern and drop hard, though the likelihood of that happening is less than the two scenarios mentioned earlier, again that is pointed to be the volume and candle type. Also when everyone is talking about a head and shoulders pattern, its chances of materializing decrease.

Moreover, NASDAQ 100 (QQQ) printed a higher relative volume inverted hammer which again signals a bounce and it closed higher than 2 previous swing lows. As I mentioned in previous posts, this is most likely because 4 (AAPL, GOOG, MSFT, AMZN) of the 10 highest weightage stocks in the index are in strong uptrend.

Considering a broader perspective, the weekly candle hints at continuing down move, though it closed off the lows. Since, the month is also over, the monthly candle is a lower relative volume inverted hammer-like, which followed a higher volume hammer. This combination suggests higher chances of reversal than continuation to the down side.

Thursday, July 28, 2011

Market update July 28, 2011

So, today market printed lower volume inverted hammer candle. Intraday, market direction was up until 12PM Eastern and then it spent the rest of the day giving it all back and then some more. Over all it was more of a day of rest after yesterday's high volume wide range decline day.

In my experience, an inverted hammer during a down swing can signal a reversal but for that to happen, the volume has to be higher than previous day. That is not the case here. But this doesn't mean that we cannot get a reversal as market is at the confluence of 61.8% fib retracement and lower Bollinger band while 200 day SMA is 1.5 points away. These are likely to provide some support.

Wednesday, July 27, 2011

Market update July 26, 2011

Market continues to be in sideways consolidation. We had a low volume spinning top like day, as the wicks were too small. This type of candle doesn't really hint at anything. Intra-day, current support on SPY is at 133, which has been tested thrice during last 4 trading days. The likelihood of it holding is decreasing with every test. Next support levels seem to be around 131.50, 130 and then 126.50. On the other side, next resistance level is at 134.80.

QQQ reached new bull market highs a couple of days ago, probably because of the higher percentage weight of tech stocks like AAPL which is ripping higher post-earnings. QQQ's breakout was on anemic volume, so that really doesn't count.

Historically the longer market stays within the trading range, the bigger the move that follows. So, we need to be patient.

Friday, July 22, 2011

Market update July 21, 2011

After 3 days of progressively lower volume rally market continued higher but this time on higher volume. Intra-day majority of volume was concentrated in the first half of the day and 134.75 was a significant level of resistance which market couldn't cross. Today's close is 2% from the current bull market high of 137.18.

How the price reacts around the previous swing high of 135.71 will determine the direction. From the current trend it appears that a breakout is imminent, but anything can happen.

Wednesday, July 20, 2011

Market update July 19, 2011

As I mentioned yesterday, a lower volume hammer was not that strong a signal of start of a sustainable rally but today we got a gap up and the market closed near the highs of the day. Volume on SPY was a bit lower than yesterday, again not supportive of a rally but it was higher on QQQ. S&P futures including the overnight session also printed a bullish engulfing candle and that too on lower volume. So, there is a bit of divergence between the volumes of these 2 indices but one such day doesn't mean anything. Even if we see this situation on a number of days I don't know what to conclude from it. So, for now the path of least resistance is up until there is evidence otherwise.

Previously my opinion was that due to summer time, we might not see a breakout of the overall market from the current trading range before start of September. But considering that a number of leading stocks are forming bases and few have just broken out, it is quite possible that we see a breakout much sooner than start of September.

Disclaimer: No position in SPY, QQQ or ES.

Tuesday, July 19, 2011

Market update July 18, 2011

After a long break, I am attempting to resume blogging about markets and trading with hopefully more insightful comments.

So, during my today's read of blogs a number of traders have pointed to the hammer candle in SPY, which has formed in one of the support zones. Although it is a positive sign, I do see one problem and that is lower volume. In my experience lower volume hammers rarely kick-off a rally. However, a bullish engulfing candle on higher volume tomorrow could confirm start of an up move. Or if price decides to stay in or close to this hammer's range could signal accumulation. Lets see what tomorrow brings.

Wednesday, May 13, 2009

SPY possibly and IWM confirmed broke out of uptrend channel


SPY closed today just at the bottom of the trend channel. After today's 2.52% drop, it might pop tomorrow and the confirmation of broken uptrend might be the day after. It also broke through short-term support around 89.75. Notice the 5 day moving average (yellow curve), which has turned downward. Also notice MACD at the bottom which is showing negative divergence (meaning downward move is accelerating).


IWM confirmed that the uptrend is broken (this was signaled yesterday). Today it broke through short-term support around 48.25. The state of 5 day moving average and MACD is similar to SPY's, mentioned above.

Disclaimer: No position in any of the mentioned securities.

Thursday, May 7, 2009

QQQQ trendline possibly broken

QQQQ may have broken below its trendline. The reason I use "may have" is that trendlines are not unique, meaning we can draw them in a variety of ways. They are primarily used as guidelines. Also, MACD is showing slight negative divergence, after a series of progressively weak up moves.

SPY is still within its trend channel. Whether it will also break below the channel remains to be seen. There is possibly short term support around 87. MACD is also showing slight weakening of the trend. Corey Rosenbloom pointed out a bearish pattern in SPY, which is a doji, followed by a hanging man, followed by a bearish engulfing candle.

On a positive note XLV broke above its trading range. This indicates investor rotation out of recently strong sectors like financials, basic materials and technology into more defensive sectors like healthcare.

Disclaimer: No current position in QQQQ, SPY or XLV.